All of the Data You Need, When You Need it


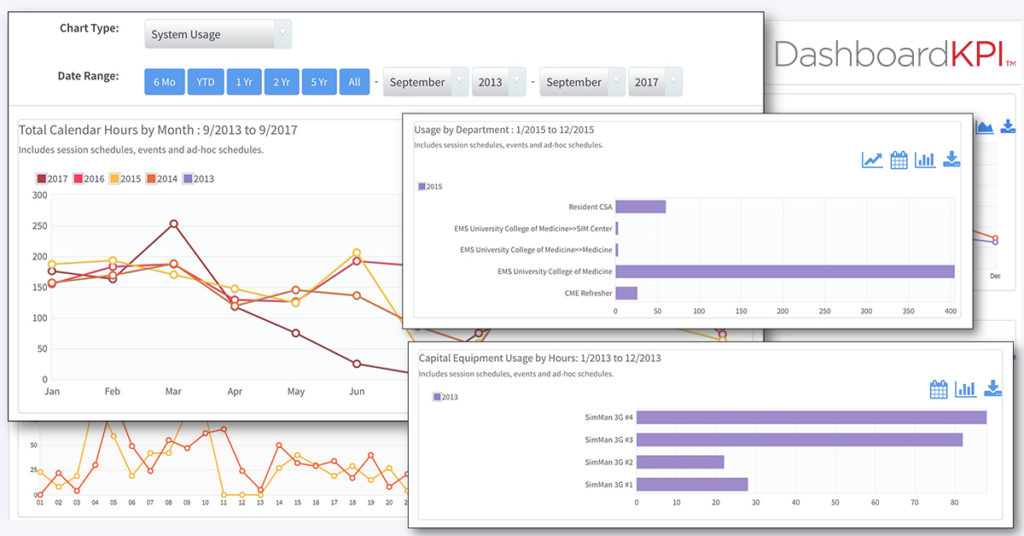
SIMULATIONiQ™ provides detailed analytics and reporting to help you manage, plan, and maximize the return on investment (ROI) of your simulation program. Simulation center administrators want peace of mind to know that their training initiatives are working efficiently. SIMULATIONiQ, with the help of DashboardKPI™, gives them the reporting capabilities they need, when they need it. It empowers them to take control of center operations, monitor trends, generate data on simulation training scenarios, and plan for the future with real-time analytics.
Track ALL these areas of your program, and more:
- SP Case and Scenario Data by Time Period
- Detailed System Usage
- Detailed Room Usage
- Capital Equipment Usage
- Total Learner, Faculty, and Support Hours by Department
- Detailed User and Login Information
- Video Hours by Room, Session & Department
- SP Case and Scenario Data by Time Period
- Detailed System Usage
- Detailed Room Usage
- Capital Equipment Usage
- Total Learner, Faculty, and Support Hours by Department
- Detailed User and Login Information
- Video Hours by Room, Session & Department


Center Utilization Reporting
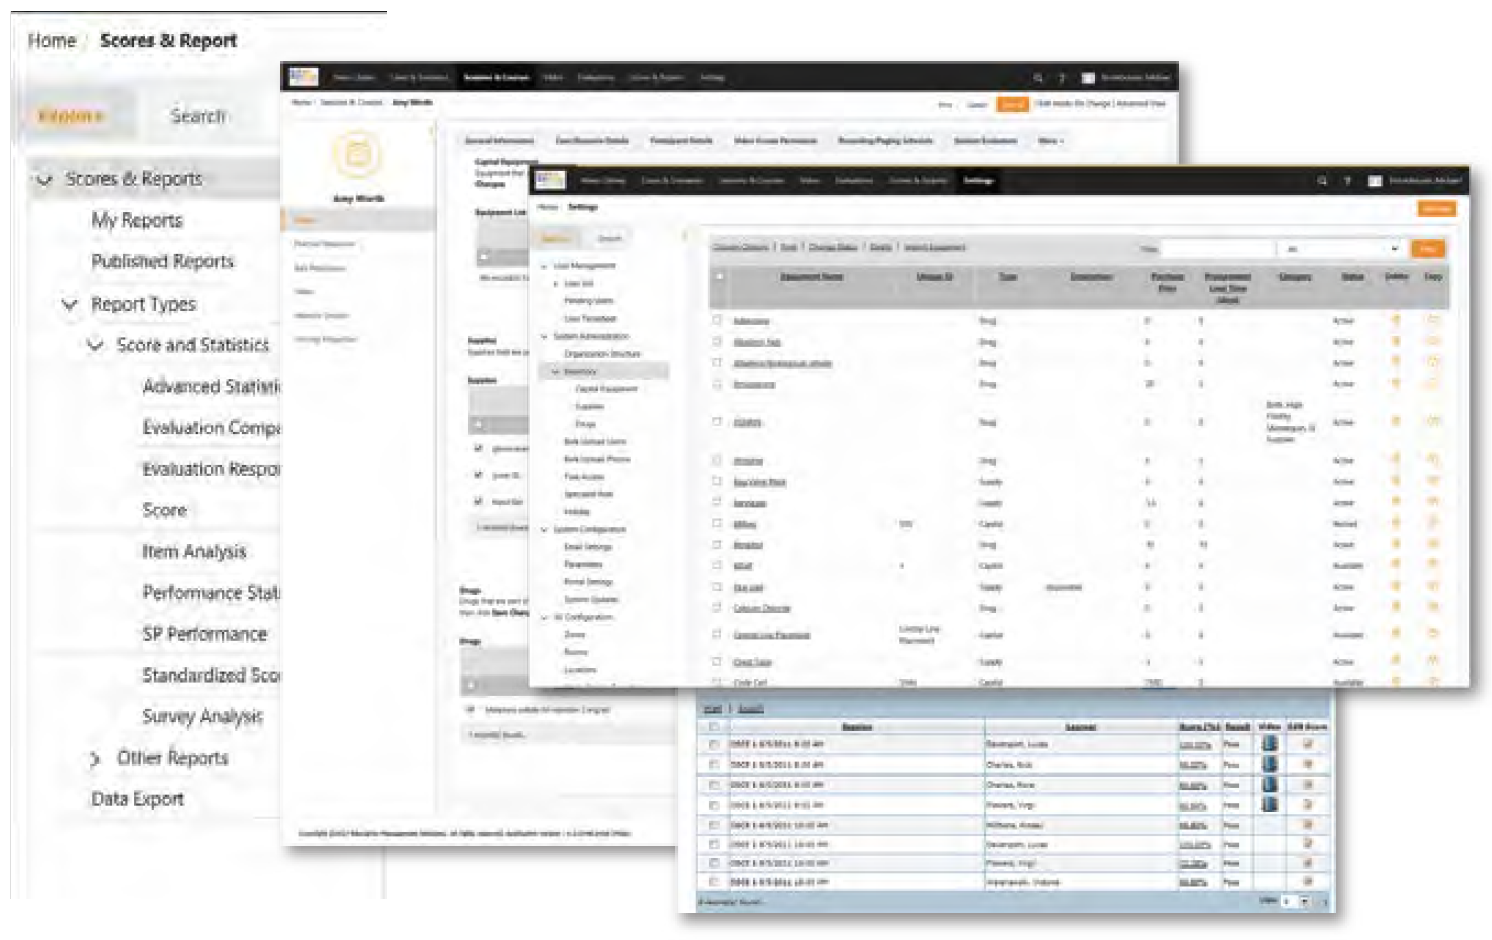
Center utilization reports provide session dates, cases/scenarios used, departments and instructors associated with sessions, and assigned evaluators to help you properly allocate resources and assign fiscal responsibilities.
Equipment Utilization Reporting
Keep track of all equipment types, including rooms, capital (manikins and task trainers), supplies, and drugs. Equipment utilization reporting allows you to identify the supplies in stock and available quantity, and when supplies get low you can put reordering on autopilot.
Individual User Data Reporting
Generate detailed information on an individual learner’s activities and enrollment, including what cases or scenarios they have finished and what simulation activities are still required for course completion.
Competency Reporting
The growing trend of tracking competencies and skills can be applied at a granular level, with reporting on performance assessments linked to specific cases or scenarios. The aggregation of these individual reports can be used for students, cohorts, and at an overall program level.
Learner Progress Reporting
Track competencies and measure performance to keep track of how your learners’ skills are developing through the duration of the clinical education program. When you measure changes between learning levels, and compare simulation outcomes against baselines and target goals, it becomes much easier to ensure your learners are mastering skills at the appropriate rate.
DashboardKPI™

DashboardKPI™ is an integrated analytics application that allows SIMULATIONiQ administrators to easily monitor trends and generate charts on activities across their entire simulation program. It aggregates the entirety of a center’s simulation data into one simplified view allowing admins to track KPIs, performance metrics, competencies, and Entrustable Professional Activities (EPAs) all in one place. With SIMULATIONiQ and DashboardKPI, simulation program administrators can collect and analyze powerful real-time analytics for the betterment of student outcomes and program success!
